Ficheru:Bmi30chart.png
Tamañu d'esta previsualización: 800 × 455 pixels. Otres resoluciones: 320 × 182 pixels | 640 × 364 pixels | 1024 × 582 pixels | 1600 × 910 pixels.
Ficheru orixinal (1600 × 910 píxels, tamañu de ficheru: 55 kB, triba MIME: image/png)
Resume
| Descripción |
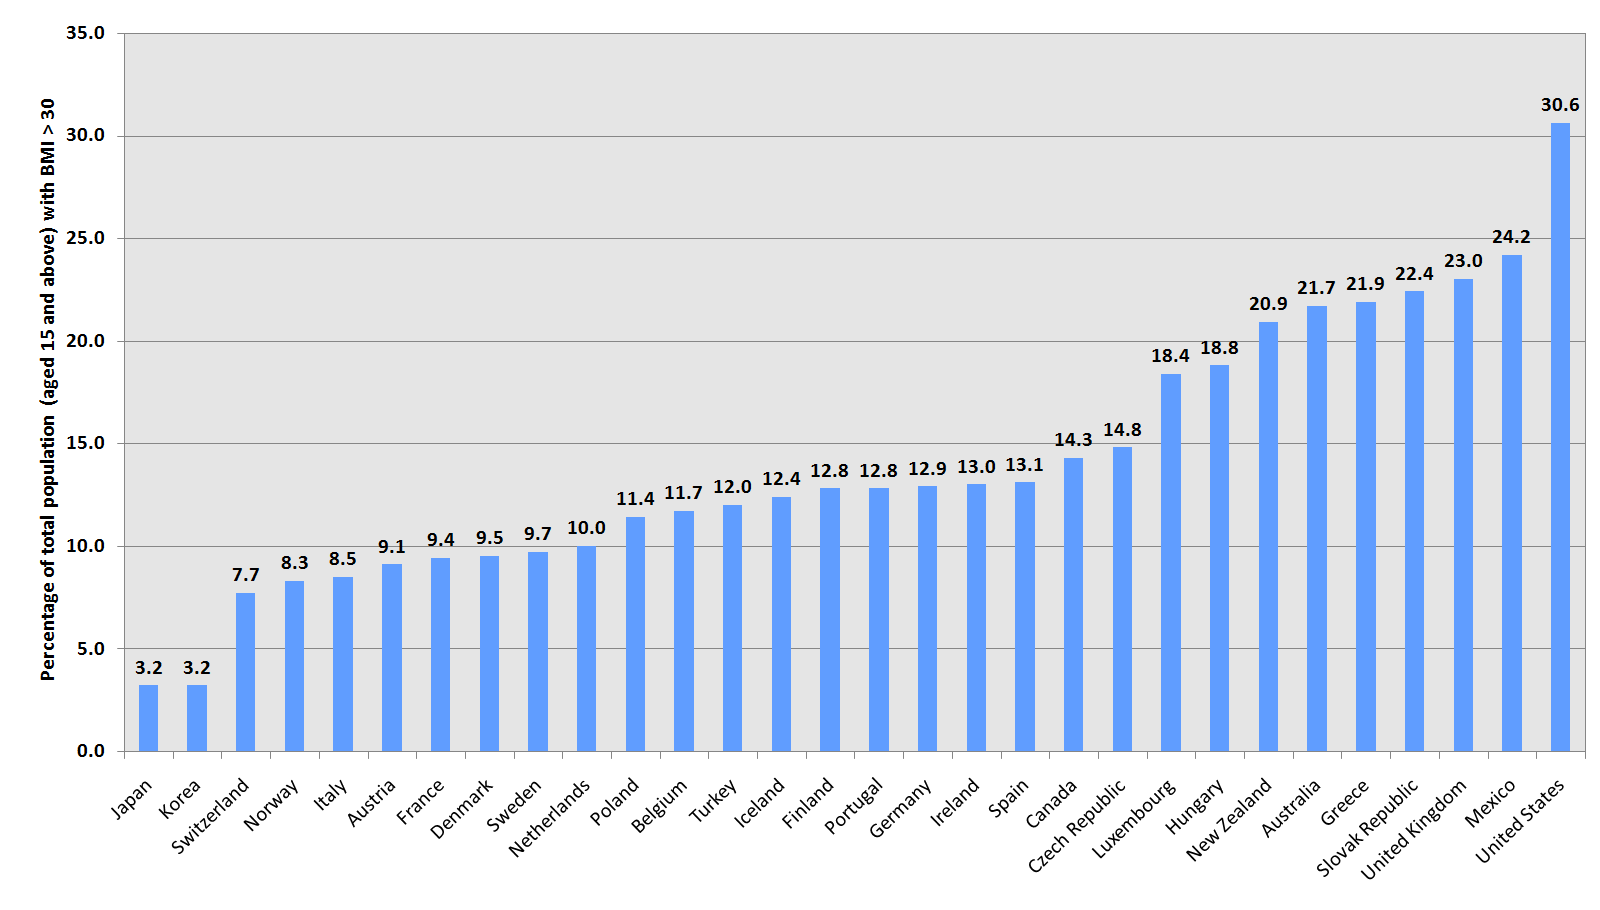
English: This chart compares figures in the population of OECD countries (plus the Czech Republic, Hungary, Poland, Slovakia and Mexico); it shows the percentage of total population (aged 15 and above) with a body mass index greater than 30. The year the figures used for this chart were published, collected or compiled range from 1996 to 2003. Exact years for each country can be found in the documents linked below. |
| Data | 25 de mayu de 2005 (fecha original de carga) |
| Fonte |
Graphic chart created by User:Phils using Microsoft Excel 2004 (Mac) and OECD data available for download and discussed here. The actual data was extracted from an Excel data sheet downloadable here, which contains the following source information:
|
| Autor | Phils de Wikipedia en inglés |
| Otres versiones | An alternate copyrighted graph of the same data, published by OECD can be viewed here. |
Llicencia
| Esti ficheru ta disponible baxo la llicencia Creative Commons Reconocimientu-Compartir igual 3.0 xenérica. Suxetu a disclaimer. | ||
| ||
| Esta etiqueta de llicencia s'amestó a esti ficheru como parte del anovamientu de la llicencia GFDL. |

|
Autorízase la copia, distribución y/o cambéu d'esti documentu baxo los términos de la Llicencia de documentación llibre GNU, versión 1.2 o cualesquier otra que nel futuru espublice la Free Software Foundation; ensin seiciones invariables, testos de portada, nin testos de contraportada. S'inclúi una copia de la llicencia na seición titulada GNU Free Documentation License. Suxetu a disclaimer. |
Rexistru de xubíes orixinal
The original description page was here. All following user names refer to en.wikipedia.
- 2007-03-24 22:42 AtilimGunesBaydin 1600×910× (56622 bytes) Updated with current data from OECD. Added Greece and Turkey existing in the OECD publication and original graph, but missing in the user-created version. Also minor changes in the order of countries.
- 2005-05-25 14:10 Phils 1467×901× (122414 bytes) {{GFDL}} This chart compares obesity figures in the population of OECD countries; it shows the percentage of total population (aged 15 and above) with a body-mass index greater than 30. The year the figures used for this chart were published, collected or
- 2005-05-25 10:46 Phils 0×0× (7028 bytes) {{GFDL}} This chart compares obesity figures in the population of OECD countries; it shows the percentage of total population (aged 15 and above) with a body-mass index greater than 30. The year the figures used for this chart were published, collected or (version lost by MediaWiki)
Historial del ficheru
Calca nuna fecha/hora pa ver el ficheru como taba daquella.
| Data/Hora | Miniatura | Dimensiones | Usuariu | Comentariu | |
|---|---|---|---|---|---|
| actual | 16:34 10 set 2012 | | 1600 × 910 (55 kB) | OgreBot | (BOT): Uploading old version of file from en.wikipedia; originally uploaded on 2007-03-24 22:42:19 by AtilimGunesBaydin |
| 17:11 4 may 2006 |  | 1467 × 901 (120 kB) | Deprifry | This chart compares obesity figures in the population of OECD countries; it shows the percentage of total population (aged 15 and above) with a body-mass index greater than 30. The year the figures used for this chart were published, collected or compiled |
Usu del ficheru
La páxina siguiente usa esti ficheru:
Usu global del ficheru
Estes otres wikis usen esti ficheru:
- Usu en de.wikipedia.org
- Usu en en.wikipedia.org
- Usu en en.wikinews.org
- Usu en fi.wikipedia.org
- Usu en fr.wikipedia.org
- Usu en it.wikipedia.org
- Usu en ja.wikipedia.org
- Usu en simple.wikipedia.org
- Usu en sr.wikipedia.org