Ficheru:2014 West Africa Ebola Epidemic - New Cases per Week.svg

Tamañu de la vista previa PNG d'esti ficheru SVG: 750 × 500 pixels. Otres resoluciones: 320 × 213 pixels | 640 × 427 pixels | 1024 × 683 pixels | 1280 × 853 pixels | 2560 × 1707 pixels.
Ficheru orixinal (ficheru SVG, 750 × 500 píxels nominales, tamañu de ficheru: 84 kB)
Resume
| Descripción |
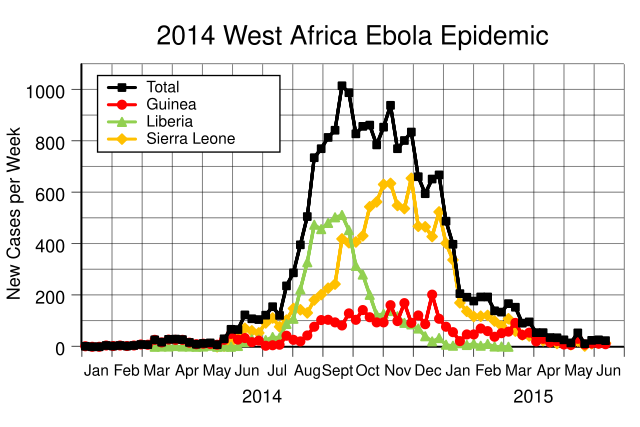
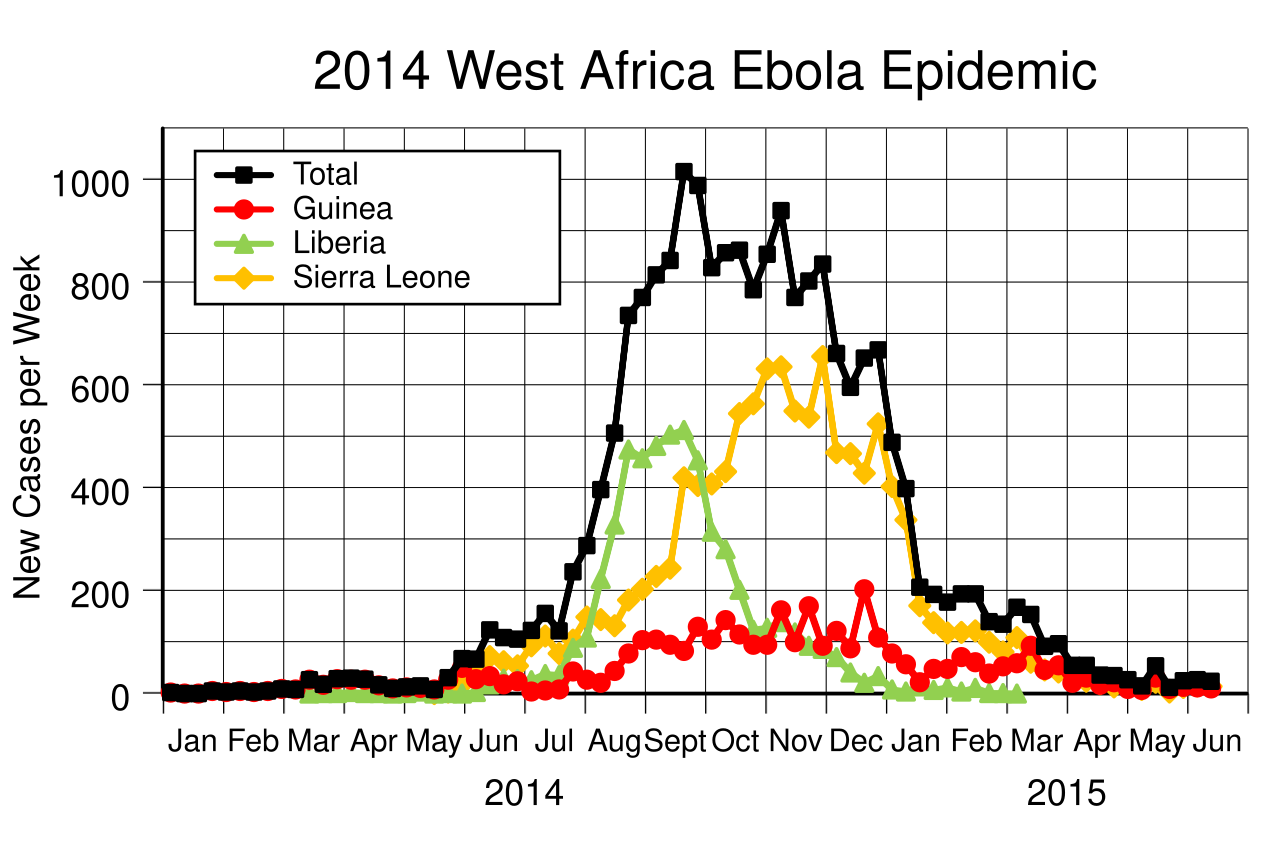
English: New cases of confirmed Ebola in West Africa each week. Data from WHO Situation reports |
| Data | |
| Fonte | Trabayu propiu |
| Autor | Delphi234 |
| SVG desarrollo | El código fuente de esta imagen SVG es válido. Este diagrama fue creado con Adobe Illustrator This diagram uses embedded text that can be easily translated using a text editor. |
Generated with Wikimedia SVG Chart
| Data format | The source data of the chart is in the SVG image file in a clearly readable format. You see the original numbers inside of the SVG file in the form of a list such as this:
... 1995 10.06 1996 11.75 1997 12.45 ... |
| Content of SVG | To view the data download the SVG file itself. To do so right-click this link, and then choose the option to save: File:2014 West Africa Ebola Epidemic - New Cases per Week.svg. Launch any text editor. Open the downloaded SVG file with the text editor (usually; file menu, open). To see the list of data, search for the phrase id="graph1". |
| Please, do not use a special SVG editor such as Inkscape; the readability of the database would be destroyed. You can edit the SVG file with any text editor, for example; en: List of text editors. You can view the edited SVG file in various web browsers. As of 2011, all major desktop browsers, and many minor ones, have some level of SVG support. See: en: Scalable Vector Graphics#Support for SVG in web browsers. When satisfied with your edits, upload the edited SVG file with the link labeled "Upload a new version of this file".
El código fuente de esta imagen SVG es inválido por un error. This W3C-invalid chart was created with Wikimedia SVG Chart. This chart is translated using SVG switch elements: all translations are stored in the same file. |
|
| Code to generate SVG | See: File talk:2014 West Africa Ebola Epidemic - New Cases per Week.svg. Documentation see: Wikimedia SVG Chart. |
Data
Data from patient database:
| Week ending | Guinea | Liberia | Sierra Leone | Other | Total | |||
|---|---|---|---|---|---|---|---|---|
| Confirmed | Suspected | Confirmed | Suspected | Confirmed | Suspected | |||
| 01/05/14 | 2 | 2 | ||||||
| 01/12/14 | 0 | |||||||
| 01/19/14 | 0 | |||||||
| 01/26/14 | 5 | 5 | ||||||
| 02/02/14 | 3 | 3 | ||||||
| 02/09/14 | 5 | 5 | ||||||
| 02/16/14 | 3 | 3 | ||||||
| 02/23/14 | 5 | 5 | ||||||
| 03/02/14 | 1 | 8 | 9 | |||||
| 03/09/14 | 2 | 6 | 8 | |||||
| 03/16/14 | 11 | 16 | 27 | |||||
| 03/23/14 | 11 | 6 | 1 | 18 | ||||
| 03/30/14 | 23 | 5 | 1 | 29 | ||||
| 04/06/14 | 22 | 5 | 2 | 1 | 30 | |||
| 04/13/14 | 27 | 1 | 28 | |||||
| 04/20/14 | 16 | 1 | 17 | |||||
| 04/27/14 | 10 | 10 | ||||||
| 05/04/14 | 3 | 9 | 1 | 13 | ||||
| 05/11/14 | 8 | 3 | 4 | 15 | ||||
| 05/18/14 | 6 | 2 | 8 | |||||
| 05/25/14 | 23 | 4 | 1 | 3 | 31 | |||
| 06/01/14 | 36 | 14 | 16 | 2 | 68 | |||
| 06/08/14 | 24 | 4 | 3 | 32 | 4 | 67 | ||
| 06/15/14 | 29 | 5 | 17 | 1 | 64 | 8 | 124 | |
| 06/22/14 | 18 | 28 | 1 | 58 | 4 | 109 | ||
| 06/29/14 | 22 | 2 | 28 | 49 | 5 | 106 | ||
| 07/06/14 | 2 | 2 | 22 | 4 | 87 | 6 | 123 | |
| 07/13/14 | 5 | 1 | 33 | 5 | 106 | 6 | 156 | |
| 07/20/14 | 5 | 3 | 27 | 9 | 76 | 2 | 122 | |
| 07/27/14 | 32 | 11 | 84 | 5 | 97 | 7 | 1 | 237 |
| 08/03/14 | 13 | 14 | 84 | 25 | 142 | 7 | 3 | 288 |
| 08/10/14 | 21 | 161 | 62 | 132 | 12 | 9 | 397 | |
| 08/17/14 | 40 | 4 | 219 | 110 | 125 | 7 | 2 | 507 |
| 08/24/14 | 75 | 3 | 344 | 131 | 171 | 11 | 1 | 736 |
| 08/31/14 | 95 | 9 | 334 | 124 | 187 | 16 | 6 | 771 |
| 09/07/14 | 101 | 4 | 364 | 118 | 213 | 15 | 0 | 815 |
| 09/14/14 | 79 | 16 | 320 | 184 | 232 | 12 | 0 | 843 |
| 09/21/14 | 82 | 1 | 311 | 202 | 384 | 36 | 0 | 1016 |
| 09/28/14 | 120 | 10 | 322 | 132 | 386 | 19 | 0 | 989 |
| 10/05/14 | 99 | 6 | 212 | 103 | 360 | 48 | 1 | 829 |
| 10/12/14 | 130 | 13 | 184 | 97 | 366 | 66 | 2 | 858 |
| 10/19/14 | 110 | 5 | 128 | 74 | 456 | 89 | 1 | 863 |
| 10/26/14 | 81 | 14 | 74 | 50 | 458 | 106 | 3 | 786 |
| 11/02/14 | 88 | 7 | 91 | 37 | 501 | 131 | 0 | 855 |
| 11/09/14 | 153 | 9 | 101 | 38 | 507 | 129 | 3 | 940 |
| 11/16/14 | 93 | 7 | 86 | 33 | 461 | 89 | 2 | 771 |
| 11/23/14 | 149 | 21 | 59 | 34 | 431 | 107 | 2 | 803 |
| 11/30/14 | 86 | 7 | 55 | 32 | 578 | 78 | 836 | |
| 12/07/14 | 111 | 11 | 55 | 16 | 382 | 87 | 662 | |
| 12/14/14 | 74 | 14 | 37 | 4 | 394 | 73 | 596 | |
| 12/21/14 | 171 | 32 | 19 | 2 | 364 | 65 | 653 | |
| 12/28/14 | 103 | 6 | 33 | 1 | 420 | 105 | 1 | 669 |
| 01/04/15 | 69 | 9 | 7 | 1 | 344 | 59 | 489 | |
| 01/11/15 | 41 | 16 | 4 | 290 | 48 | 399 | ||
| 01/18/15 | 19 | 3 | 12 | 2 | 120 | 51 | 207 | |
| 01/25/15 | 32 | 16 | 6 | 1 | 107 | 31 | 193 | |
| 02/01/15 | 41 | 7 | 7 | 5 | 83 | 35 | 178 | |
| 02/08/15 | 64 | 7 | 3 | 1 | 91 | 28 | 194 | |
| 02/15/15 | 52 | 9 | 8 | 3 | 98 | 24 | 194 | |
| 02/22/15 | 37 | 2 | 1 | 80 | 20 | 140 | ||
| 03/01/15 | 53 | 1 | 66 | 15 | 135 | |||
| 03/08/15 | 58 | 1 | 89 | 20 | 168 | |||
| 03/15/15 | 93 | 35 | 26 | 154 | ||||
| 03/22/15 | 44 | 2 | 32 | 14 | 92 | |||
| 03/29/15 | 55 | 22 | 20 | 97 | ||||
| 04/05/15 | 21 | 13 | 21 | 55 | ||||
| 04/12/15 | 31 | 13 | 11 | 55 | ||||
| 04/19/15 | 16 | 1 | 15 | 4 | 36 | |||
| 04/26/15 | 22 | 6 | 7 | 35 | ||||
| 05/03/15 | 9 | 8 | 10 | 27 | ||||
| 05/10/15 | 7 | 3 | 5 | 15 | ||||
| 05/17/15 | 27 | 4 | 7 | 15 | 1 | 54 | ||
| 05/24/15 | 9 | 7 | 25 | 41 | ||||
| 05/31/15 | 13 | 12 | 10 | 35 | ||||
| 06/07/15 | 12 | 13 | 7 | 32 | ||||
| 06/14/15 | 10 | |||||||
| Total | 2307 | 419 | 3893 | 1651 | 9792 | 1858 | 37 | 20886 |
Data from situation reports (used for most recent four weeks):
| Week ending | Guinea | Liberia | Sierra Leone | Other | Total | |||
|---|---|---|---|---|---|---|---|---|
| Confirmed | Suspected | Confirmed | Suspected | Confirmed | Suspected | |||
| 03/23/14 | 1 | 1 | ||||||
| 03/30/14 | 0 | |||||||
| 04/06/14 | 2 | 2 | ||||||
| 04/13/14 | 0 | |||||||
| 04/20/14 | 0 | |||||||
| 04/27/14 | 0 | |||||||
| 05/04/14 | 1 | 1 | ||||||
| 05/11/14 | 4 | 4 | ||||||
| 05/18/14 | 0 | |||||||
| 05/25/14 | 0 | |||||||
| 06/01/14 | 0 | |||||||
| 06/08/14 | 3 | 3 | ||||||
| 06/15/14 | 15 | 15 | ||||||
| 06/22/14 | 26 | 26 | ||||||
| 06/29/14 | 25 | 25 | ||||||
| 07/06/14 | 20 | 20 | ||||||
| 07/13/14 | 27 | 27 | ||||||
| 07/20/14 | 23 | 23 | ||||||
| 07/27/14 | 66 | 66 | ||||||
| 08/03/14 | 59 | 59 | ||||||
| 08/10/14 | 79 | 79 | ||||||
| 08/17/14 | 140 | 140 | ||||||
| 08/24/14 | 265 | 265 | ||||||
| 08/31/14 | 255 | 255 | ||||||
| 09/07/14 | 248 | 248 | ||||||
| 09/14/14 | 321 | 321 | ||||||
| 09/21/14 | 77 | 1 | 352 | 241 | 254 | 925 | ||
| 09/28/14 | 117 | 9 | 442 | 193 | 350 | 1111 | ||
| 10/05/14 | 95 | 4 | 358 | 149 | 315 | 1 | 922 | |
| 10/12/14 | 137 | 10 | 389 | 117 | 371 | 2 | 1026 | |
| 10/19/14 | 102 | 0 | 316 | 211 | 386 | 1 | 1016 | |
| 10/26/14 | 75 | 9 | 258 | 78 | 399 | 9 | 3 | 831 |
| 11/02/14 | 93 | 0 | 132 | 106 | 435 | 5 | 771 | |
| 11/09/14 | 145 | 3 | 129 | 103 | 421 | 3 | 804 | |
| 11/16/14 | 81 | 4 | 87 | 90 | 533 | 2 | 797 | |
| 11/23/14 | 148 | 6 | 70 | 60 | 385 | 2 | 671 | |
| 11/30/14 | 77 | 0 | 64 | 61 | 537 | 739 | ||
| 12/07/14 | 96 | 7 | 53 | 72 | 397 | 625 | ||
| 12/14/14 | 76 | 43 | 37 | 36 | 327 | 519 | ||
| 12/21/14 | 156 | 0 | 23 | 19 | 315 | 513 | ||
| 12/28/14 | 115 | 12 | 31 | 19 | 337 | 1 | 515 | |
| 01/04/15 | 74 | 7 | 9 | 41 | 248 | 379 | ||
| 01/11/15 | 42 | 2 | 8 | 22 | 184 | 258 | ||
| 01/18/15 | 20 | 2 | 8 | 15 | 117 | 162 | ||
| 01/25/15 | 30 | 1 | 4 | 10 | 65 | 110 | ||
| 02/01/15 | 39 | 2 | 5 | 6 | 80 | 132 | ||
| 02/08/15 | 65 | 1 | 4 | 3 | 76 | 149 | ||
| 02/15/15 | 52 | 5 | 1 | 96 | 154 | |||
| 02/22/15 | 35 | 1 | 11 | 63 | 110 | |||
| 03/01/15 | 51 | 2 | 81 | 134 | ||||
| 03/08/15 | 58 | 2 | 58 | 118 | ||||
| 03/15/15 | 95 | 55 | 150 | |||||
| 03/22/15 | 45 | 1 | 1 | 33 | 80 | |||
| 03/29/15 | 57 | 25 | 82 | |||||
| 04/05/15 | 21 | 9 | 30 | |||||
| 04/12/15 | 28 | 9 | 37 | |||||
| 04/19/15 | 19 | 12 | 31 | |||||
| 04/26/15 | 22 | 11 | 33 | |||||
| 05/03/15 | 9 | 9 | 18 | |||||
| 05/10/15 | 7 | 2 | 9 | |||||
| 05/17/15 | 27 | 4 | 8 | 1 | 40 | |||
| 05/24/15 | 9 | 3 | 12 | |||||
| 05/31/15 | 13 | 12 | 25 | |||||
| 06/07/15 | 12 | 15 | 27 | |||||
| 06/14/15 | 10 | 14 | 24 | |||||
Llicencia
Yo, el titular de los drechos d'autor d'esta obra, la espublizo baxo la siguiente llicencia:
| Esti ficheru ta disponible baxo la llicencia Creative Commons de Dedicatoria universal al dominiu públicu CC0 1.0. | |
| La persona qu'asoció una obra con esti documentu dedicó esa obra al dominiu públicu per aciu de la cesión mundial de los sos drechos baxo les lleis de drechos d'autor, incluyendo tolos los drechos llegales rellacionaos y axacentes, dientro del ámbitu permitíu pola llei. Pue copiar, camudar, distribuir y reproducir la obra, incluyendo con oxetivos comerciales, ensin pidir permisu.
|
Historial del ficheru
Calca nuna fecha/hora pa ver el ficheru como taba daquella.
| Data/Hora | Miniatura | Dimensiones | Usuariu | Comentariu | |
|---|---|---|---|---|---|
| actual | 15:10 15 xun 2021 | | 750 × 500 (84 kB) | JoKalliauer | 1) fixed phab:T36947; 2)fill=" x " was invalid 3) stroke="yes" was invalid |
| 17:19 9 feb 2019 |  | 750 × 500 (83 kB) | MSG17 | Tried to make it more W3C compatible | |
| 11:20 1 avi 2018 |  | 750 × 500 (83 kB) | 4nn1l2 | fixed years for Arabic | |
| 11:09 1 avi 2018 |  | 750 × 500 (82 kB) | 4nn1l2 | fixed fa and ar | |
| 18:11 20 xun 2015 |  | 750 × 500 (84 kB) | Delphi234 | translation | |
| 18:03 20 xun 2015 |  | 750 × 500 (84 kB) | Delphi234 | update through 14 Jun | |
| 23:31 27 abr 2015 |  | 750 × 500 (79 kB) | Delphi234 | update through 19 Apr | |
| 05:08 8 mar 2015 |  | 750 × 520 (76 kB) | Delphi234 | update through Mar 1 | |
| 22:19 28 feb 2015 |  | 750 × 520 (76 kB) | Delphi234 | update from Feb 25 Situation Report | |
| 06:10 23 feb 2015 |  | 750 × 520 (76 kB) | Delphi234 | update through Feb 18 |
Usu del ficheru
La páxina siguiente usa esti ficheru:
Usu global del ficheru
Estes otres wikis usen esti ficheru:
- Usu en ar.wikipedia.org
- Usu en arz.wikipedia.org
- Usu en bn.wikipedia.org
- Usu en cs.wikipedia.org
- Usu en dag.wikipedia.org
- Usu en de.wikipedia.org
- Usu en en.wikipedia.org
- Usu en en.wikiversity.org
- Usu en fa.wikipedia.org
- Usu en fi.wikipedia.org
- Usu en ha.wikipedia.org
- Usu en hi.wikipedia.org
- Usu en hu.wikipedia.org
- Usu en hy.wikipedia.org
- Usu en hyw.wikipedia.org
- Usu en ia.wikipedia.org
- Usu en it.wikipedia.org
- Usu en ko.wikipedia.org
- Usu en nl.wikipedia.org
- Usu en pt.wikipedia.org
- Usu en ru.wikipedia.org
- Usu en ru.wikinews.org
- Usu en shi.wikipedia.org
- Usu en si.wikipedia.org
- Usu en sv.wikipedia.org
- Usu en sw.wikipedia.org
- Usu en sw.wiktionary.org
- Usu en th.wikipedia.org
- Usu en tr.wikipedia.org
- Usu en tt.wikipedia.org
- Usu en uk.wikipedia.org
- Usu en vi.wikipedia.org
- Usu en wa.wikipedia.org
- Usu en www.wikidata.org
- Usu en zgh.wikipedia.org
- Usu en zh.wikipedia.org